This is a list of stocks that members asked us to do extra research on none of these are alerts/buy/sell recommendations.

Company: InterDigital, Inc.
Quote: $IDCC
Bull Case:
The upside angle revolves around underappreciated revenue streams. There’s potential acceleration coming from streaming-related contributions that hasn’t fully shown up in models yet.
At the same time, the rollout of IoT-optimized LTE standards now recognized as part of the 5G framework could quietly expand the number of connected devices paying into InterDigital’s ecosystem.
This is how the model scales: not by selling more units, but by increasing the number of endpoints tied to their IP.
Bear Case:
The risk, as always with this model, is lumpiness and uncertainty.
Revenue is heavily tied to licensing agreements, which means arbitration and litigation are part of the business not exceptions.
The ongoing situation with Samsung is a good example. Until that’s resolved, there’s a cloud over a meaningful portion of revenue visibility.
On top of that, the smartphone market still a core driver has shown periods of stagnation. When device growth slows, so does the underlying royalty base.
So even if the long-term thesis is intact, the timing of revenue can be unpredictable.
Sharks Opinion:
From a trading standpoint, this is where we step back.
At roughly 15–16x revenue, the stock is already pricing in a lot of that upside.
For a business with this level of revenue variability, that’s a tough multiple to justify in the near term.
We peg fair value somewhere in the $5B–$6B range, and at current levels, it feels stretched relative to the risk profile.
InterDigital is a fascinating company arguably one of the purest “idea monetization” businesses in the market.
But from a trading perspective, it’s high quality with high unpredictability.
Unless they unlock a new, meaningful revenue stream or land a major licensing inflection, this remains more of a watchlist name than a capital deployment opportunity.
Interesting — but not clean.
InterDigital is one of those names that looks simple on the surface but once you dig in, you realize it’s operating in a completely different lane than most public companies.
This isn’t a product company. It’s an intellectual property engine.
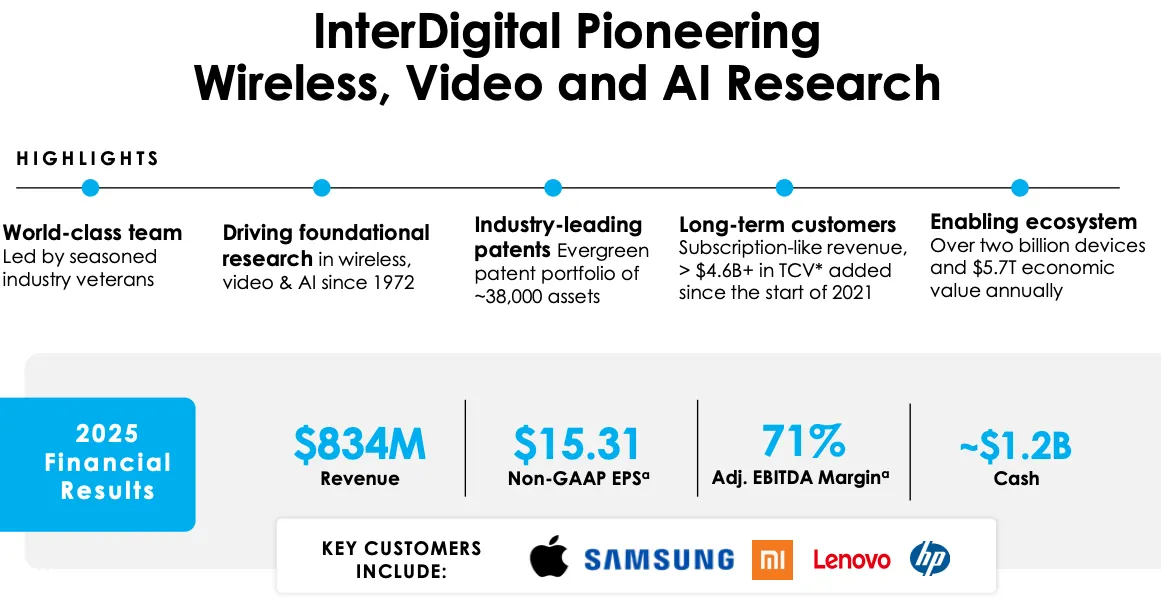
Roughly 90% of the workforce consists of engineers and inventors, focused almost entirely on long-term R&D. The output of that effort is a portfolio of 30,000+ patents, which they then license out to the biggest players in tech companies like Apple, Samsung, Huawei, and Google.
Description: InterDigital Inc is a research and development company focused on wireless, Video, Artificial Intelligence, and related Technologies. It designs and develops technologies that enable connected, immersive experiences in a broad range of communications and entertainment products and services. The majority of revenue is generated from fixed-fee patent license agreements, with a smaller portion coming from variable royalty agreements. Geographically, it operates in the United States, China, South Korea, Japan, Taiwan, and Europe, with the majority is from China.
InterDigital sits in a very specific corner of the tech ecosystem it’s not building products, it’s building the underlying rules those products operate on.
At its core, this is a pure R&D + licensing business. They develop communication and video technologies, patent them, and then license that IP out to manufacturers who need to comply with global standards.
Revenue is primarily driven by long-term licensing agreements, typically structured as fixed contracts lasting 5–7 years, with a smaller portion coming from variable royalty streams.
What makes this model powerful is standardization.
InterDigital’s technology is embedded into global communication standards, which means if a company wants to build devices that operate within those standards, they have to license the IP.
That’s why renewal rates matter and IDCC has managed to renew ~99% of expired contracts, representing roughly $2.5B in total value.
Revenue Mix & Expansion Angle:
Right now, the business is still heavily tied to mobile:
~85% Smartphones: phones, tablets, base stations
~15% Consumer Electronics / IoT / Auto: TVs, laptops, gaming, streaming devices, connected vehicles
But the strategic shift is clear.
Management is actively pushing to expand CE & IoT toward ~25% of revenue, leveraging their growing patent portfolio in both wireless and video technologies.
That matters because it diversifies away from smartphone dependency and plugs them into broader connectivity trends smart devices, vehicles, and everything becoming network-enabled.
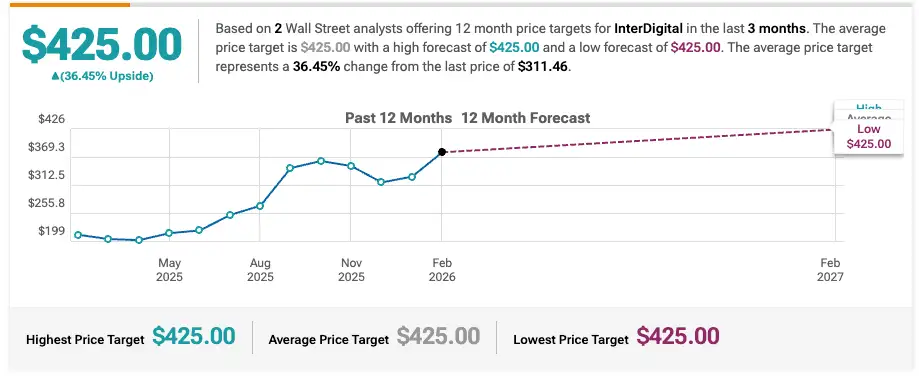
Roth Capital Maintains Buy on InterDigital, Raises Price Target to $350
Company: United States Antimony Corporation
Quote: $UAMY
Bull Case:
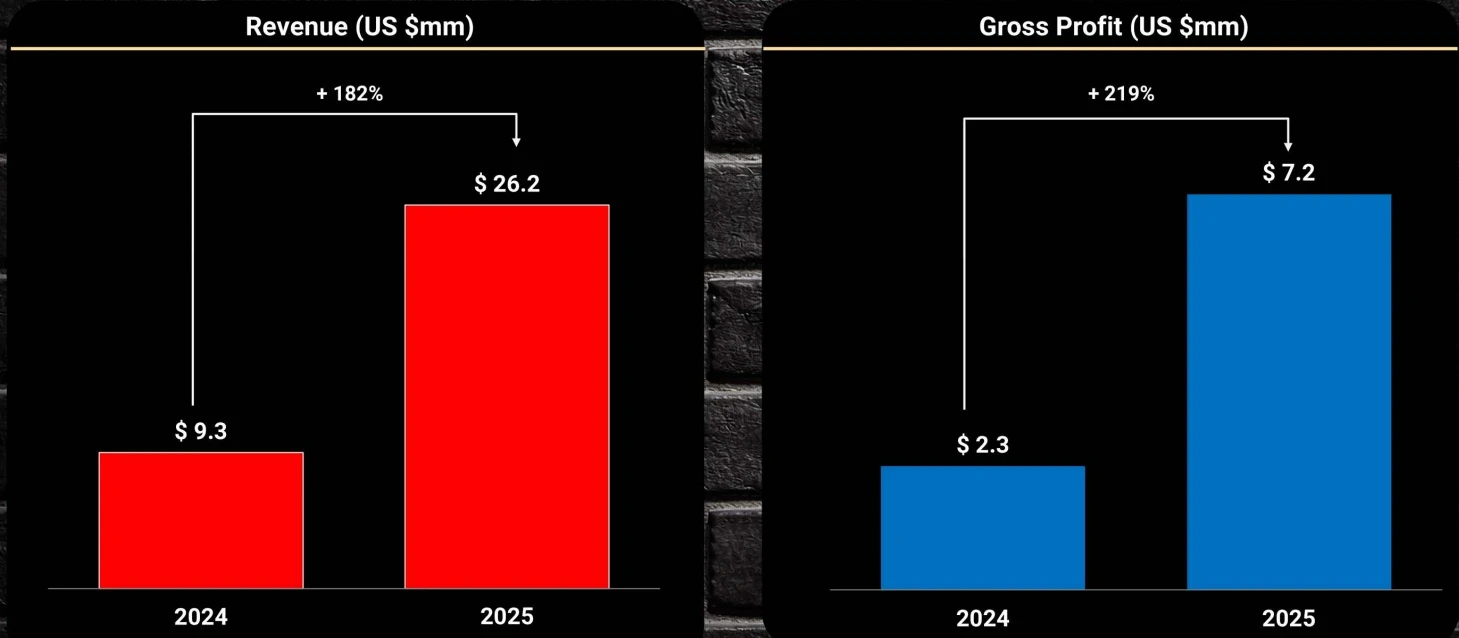
United States Antimony is benefiting from a favorable pricing environment, with higher antimony prices driving meaningful revenue growth alongside a 12% increase in sales volume. Management is actively reinvesting into the business to expand domestic supply capabilities, which could translate into stronger margins and improved cash flow as operations scale.
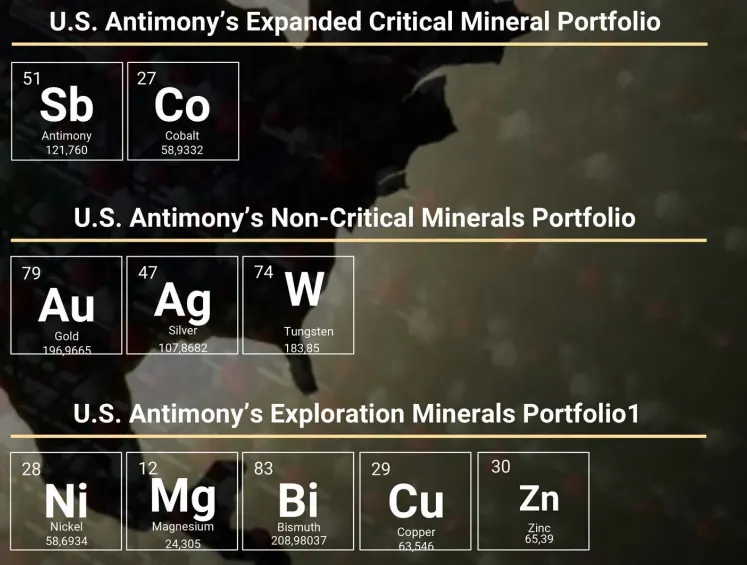
There’s also a broader structural tailwind forming. As the US pushes to secure domestic supply chains for critical minerals, companies like UAMY become increasingly relevant. With limited publicly traded exposure to antimony and rare earthrelated materials, the company is positioned to benefit from both policy support and market demand. The addition of other critical minerals into its portfolio further strengthens its long-term optionality.
Bear Case:
Despite the revenue growth, the company reported a net loss of $3.9 million, largely driven by share-based compensation and elevated operating costs. This raises concerns around execution and whether management can scale efficiently without continuously diluting shareholders.
Operationally, a large portion of UAMY’s assets are still in the exploration phase, meaning future production is not guaranteed. That introduces uncertainty around long-term output and revenue stability. On top of that, the business remains highly sensitive to commodity prices. Any pullback in antimony pricing could quickly compress margins and reverse recent momentum.
Geopolitical tensions also create risk on the supply side, and with much of the company’s revenue tied to the US, there is limited geographic diversification to offset potential disruptions.
Sharks Opinion:
UAMY is one of those trades where the macro matters more than the micro.
The real story isn’t just antimony, it’s the broader shift in global supply chains. While most people focus on US and China tensions through Taiwan, the more immediate battleground is resources. Materials like antimony, tungsten, and rare earths are critical to both industrial systems and defense infrastructure, and that shift is already underway. UAMY just happens to be one of the few ways to express that theme in US markets.
That said, this is still a micro-cap mining name, and it comes with everything that implies. High volatility, inconsistent earnings, and heavy dependence on commodity pricing and execution. It’s not a clean fundamental story, it’s a thematic and technical setup.
From a trading perspective, the setup is what stands out. There are very few US-listed names in this space, and that scarcity can drive outsized moves when the theme gets attention. With a relatively tight float and around 19% short interest, any positive catalyst could create a squeeze dynamic where buyers overwhelm sellers quickly.
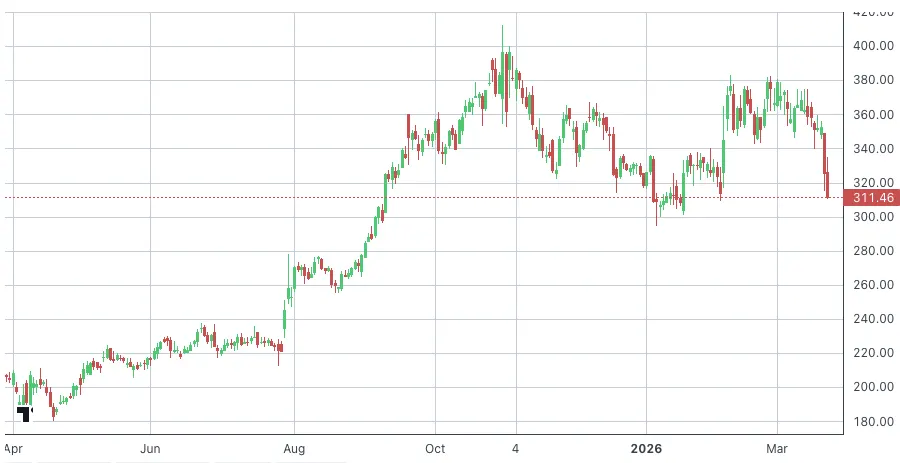
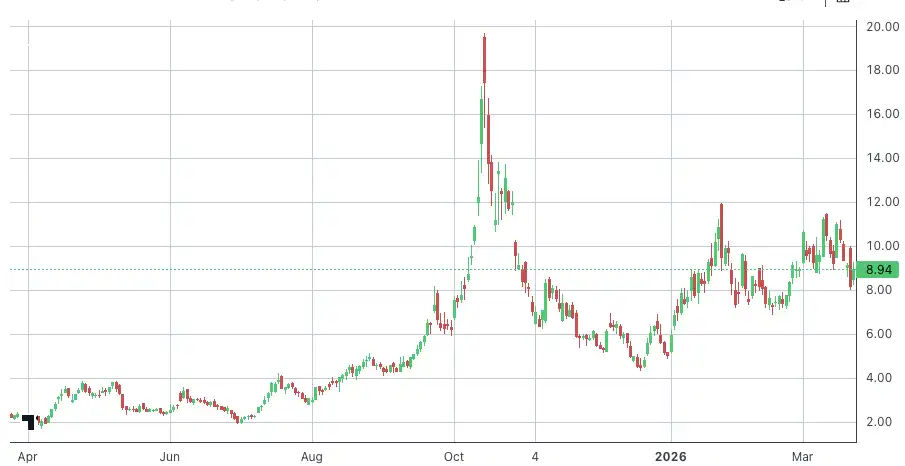
This is not a conviction hold, it’s a high-risk, highreward trade. If the rare earth and critical minerals narrative heats up, the stock can move aggressively higher and something like $12 is in play. If sentiment fades or execution disappoints, it can unwind just as fast back toward $2.
That’s the nature of these names.
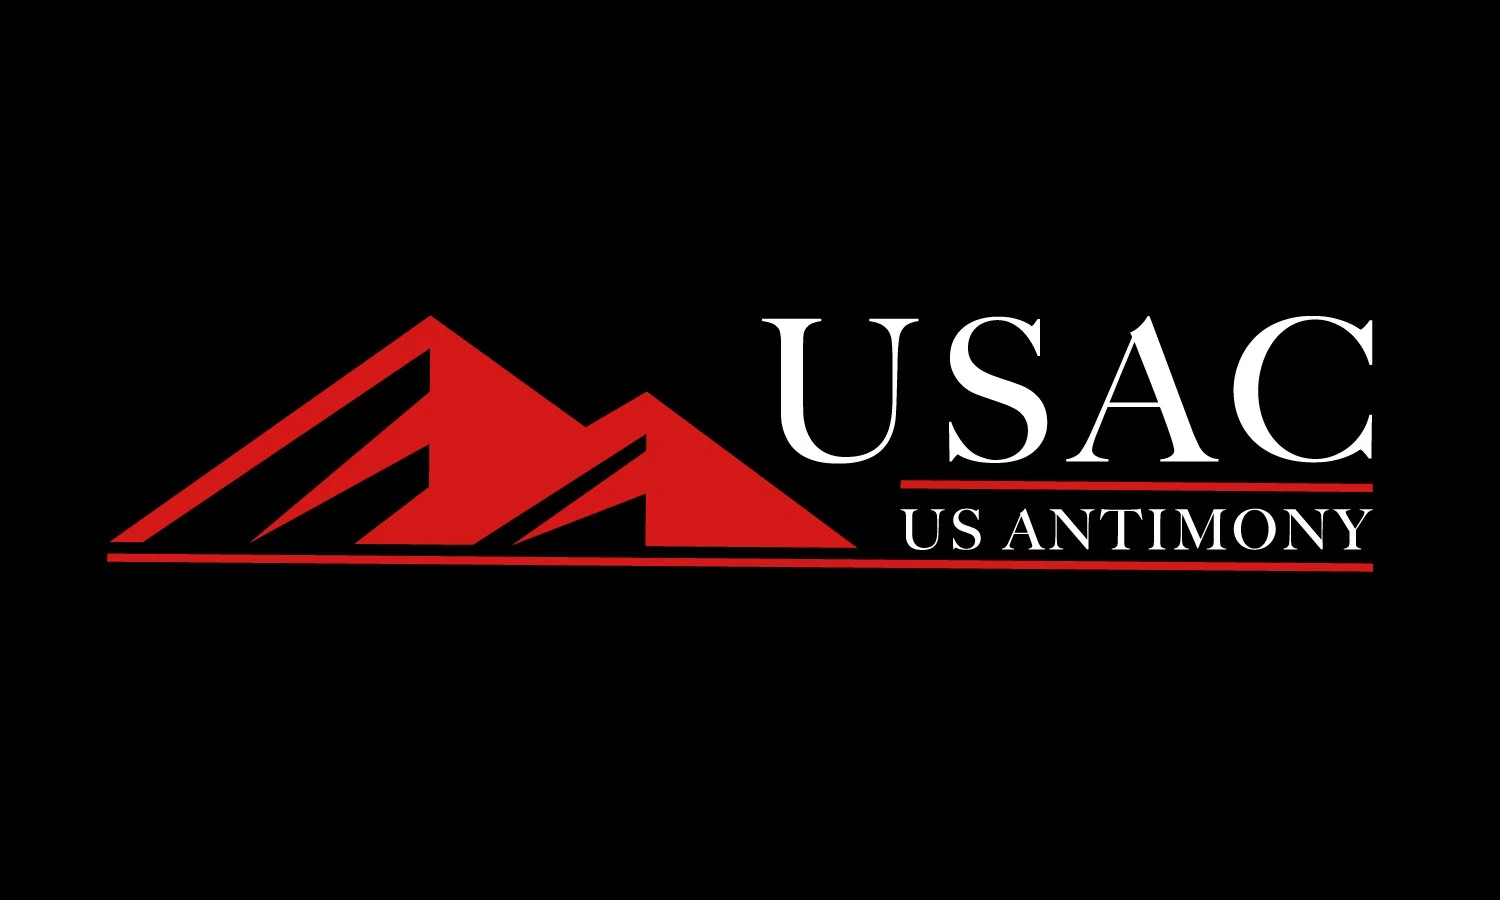
Description: United States Antimony Corp is a fully integrated mining, transportation, milling, smelting, and selling company. It has two operating segments: antimony and zeolite. Its products and services include antimony; silver; gold; zeolite products; and storage, handling, & packaging services. The company's geographical segments are the United States, Canada, and Mexico, of which the vast majority of its revenue comes from the United States.
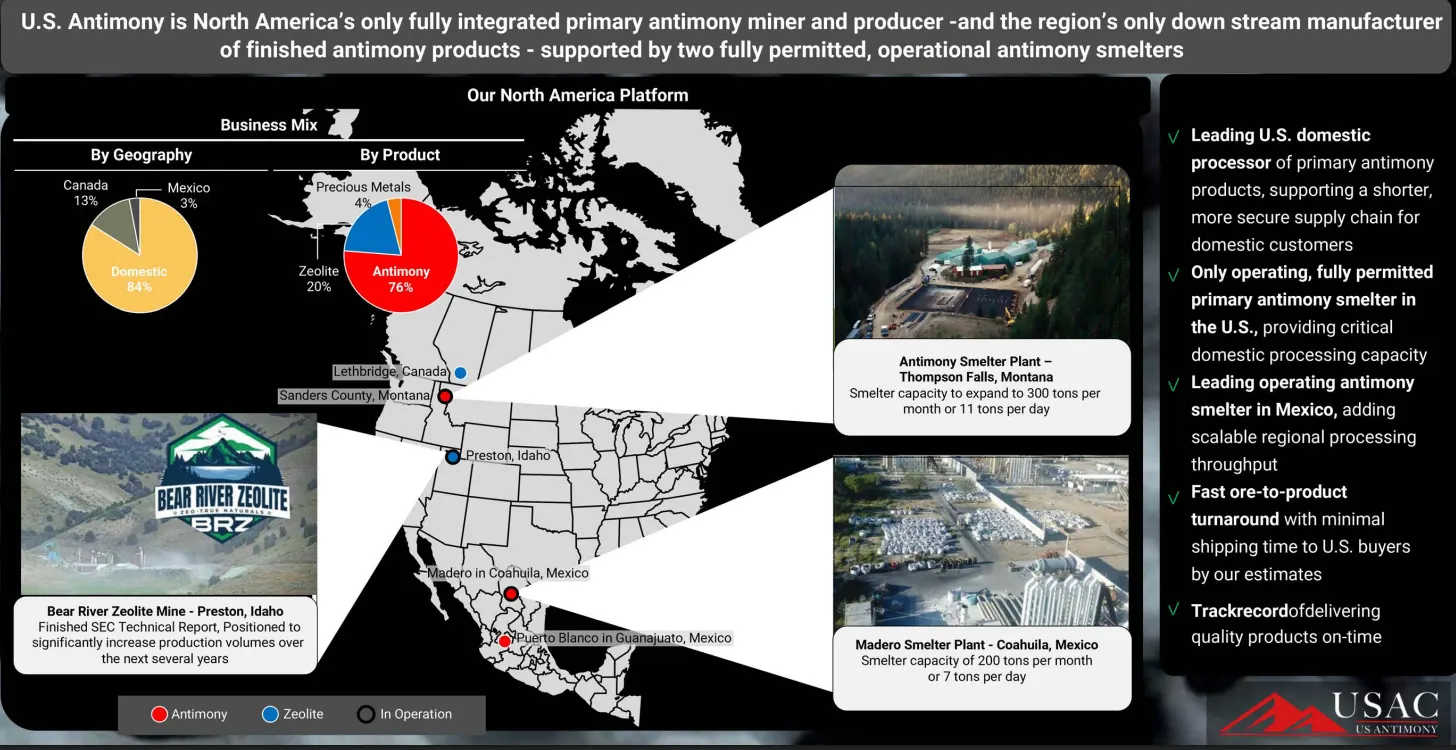
UAMY operates across a few key verticals, but the core of the business is clearly antimony. This is where the real value sits. They produce antimony trioxide used in flame retardants, antimony metal tied to defense applications and batteries, and antimony trisulfide used in ammunition. It’s a niche market, but an important one, especially as supply chains tighten.
Outside of that, the company has built out additional exposure through its zeolite operations in Idaho, which feed into industrial applications like water filtration, agriculture, and environmental cleanup. There’s also a smaller layer of precious metals recovery in Montana, where they extract gold and silver from ore. These segments add diversification, but they’re not the primary driver of the story.
The bigger picture comes down to positioning.
After China’s 2024 ban on antimony exports, the dynamic shifted quickly. What was once a niche material became a strategic one. UAMY now sits in a critical position within the US supply chain, backed by a sole-source contract with the Defense Logistics Agency that could reach up to $248 million, alongside an additional $106.7 million industrial supply agreement. That’s not just revenue visibility, it’s validation.
At the same time, management is pushing toward vertical integration in a meaningful way. They’ve expanded their land position to over 32,000 acres across Montana, Alaska, and Ontario, aiming to reduce reliance on third-party ore and bring more of the supply chain in-house. If executed properly, that shift can improve margins and give them more control over production.
Financially, the impact is already showing up. Revenue surged 163% to $39.3 million in 2025, driven by both higher antimony prices and increased volume. It’s a sharp move, but one that’s heavily tied to the current pricing environment.
So when you step back, this is a company in transition.
They’re moving from being a small, somewhat overlooked operator into a more strategically relevant player in a tightening market. The opportunity is there, but so is the execution risk. Scaling production, integrating new assets, and maintaining margins in a volatile commodity environment is not straightforward.
UAMY’s recent quarter shows a company that is clearly growing, but still working through the growing pains that come with scaling a mining operation.
Q4 revenue came in around $13.03 million, continuing the trend of rapid topline expansion we’ve been seeing over the past few quarters. That growth is real and largely tied to stronger antimony pricing and increased production activity. It confirms that demand is there and that the company is starting to benefit from its positioning in the market.
On the earnings side, the story is less clean. The company reported a slight loss for the quarter, roughly around breakeven depending on how you look at it, with EPS coming in at about negative $0.01 to negative $0.04. For the full year, net losses widened to $4.3 million compared to $1.7 million the year prior. A large portion of that increase was driven by $6.7 million in non-cash expenses, which softens the blow somewhat, but it still highlights that profitability hasn’t caught up to revenue growth yet.
Margins remain under pressure, with profit margins sitting around negative 11%. That’s typical for a company in this phase, but it reinforces the idea that they are still investing heavily into expansion rather than optimizing for efficiency.
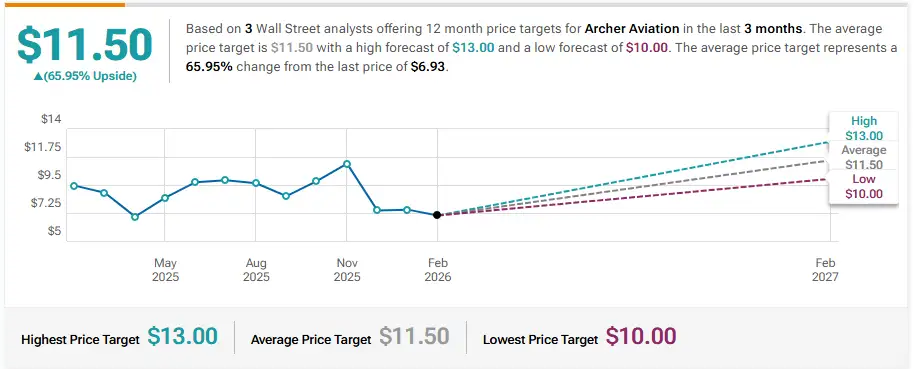
HC Wainwright & Co. Maintains Buy on United States Antimony, Raises Price Target to $11.5
B. Riley Securities Maintains Buy on United States Antimony, Raises Price Target to $11

Company: Lam Research
Quote: $LRCX
Bull Case:
Lam Research continues to show strong positioning within the semiconductor equipment cycle, driven largely by a resurgence in memory spending. DRAM revenue jumped 36% quarterover-quarter to $772 million, signaling that memory is no longer a drag but is now becoming a key growth driver. At the same time, services revenue grew 12% to $2.0 billion, reinforcing the stability and recurring nature of that segment.
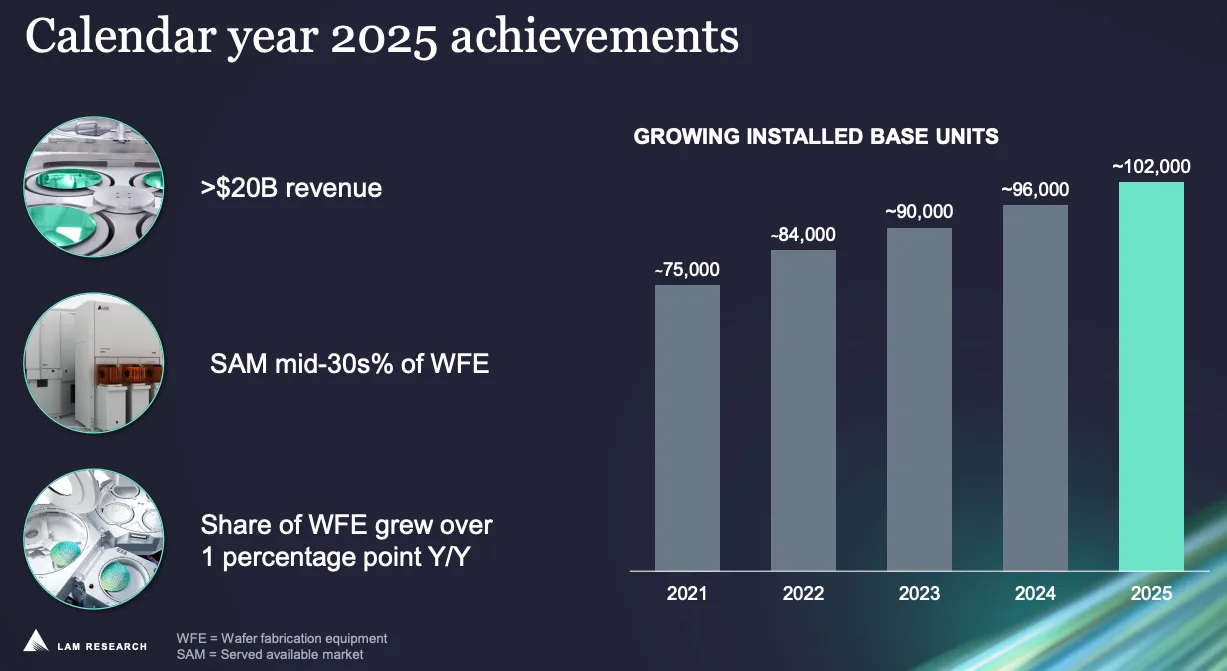
Beyond the numbers, the company’s market share expansion tells the bigger story. Over the past decade, Lam has grown its share of the global wafer fabrication equipment market from roughly 10% to around 15%, which speaks to its ability to innovate and consistently win share in a highly competitive space. New product adoption, particularly tools like the Akara conductor etch system, is helping drive that momentum.
Looking forward, management is guiding for a 23% year-over-year expansion in the wafer fabrication equipment market to $135 billion by 2026. If that plays out, Lam is well positioned to capture a meaningful portion of that growth, especially given its exposure to both memory and logic customers.
Bear Case:
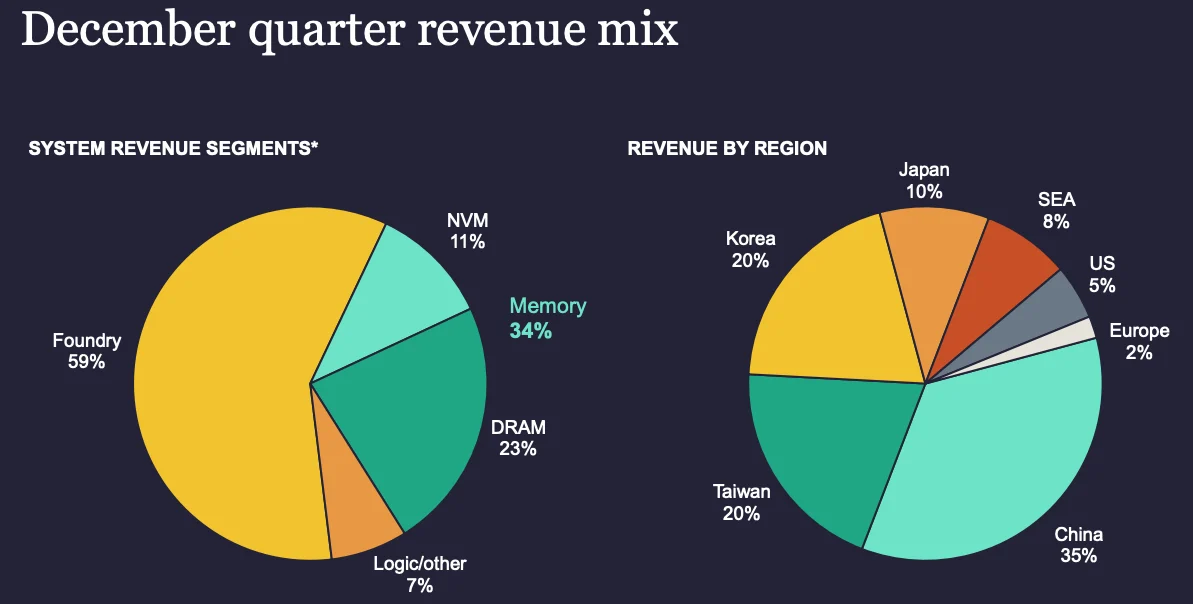
Despite the strong top-line trends, there are cracks forming underneath. Gross margin came in at 49.7%, which beat guidance but still declined by 90 basis points quarter-over-quarter. That compression was driven by an unfavorable customer mix and reduced revenue contribution from China, both of which could persist.
China remains a key overhang. Export controls have already reduced its contribution to about 35% of total revenue, and that figure is expected to decline further. That creates both a revenue headwind and uncertainty around future demand visibility.
At the same time, demand from leading-edge customers is showing signs of slowing. Companies like TSMC and Samsung are moderating spending, while Intel has pulled back on capital expenditures. These are core customers, so any slowdown directly impacts Lam’s order flow.
There are also operational constraints to consider.
Limited cleanroom capacity could restrict the company’s ability to fulfill orders, potentially leading to delays or cancellations. In a cyclical industry, those bottlenecks can amplify downturns just as much as they limit upside during expansions.
Sharks Opinion:
Lam Research is one of those names where the question isn’t whether it’s a good company, it’s whether the timing lines up.
This is a premier player in semiconductor equipment with a strong balance sheet, deep customer relationships, and a proven ability to navigate cycles. The fundamentals are there, and they’ve consistently shown they can grow through both memory and logic cycles when demand is present.
The sector itself is cyclical, and that’s where most of the hesitation comes from. You will get periods of slowdown, margin pressure, and uneven demand. But stepping back, the bigger picture still points toward a capital expenditure supercycle driven by AI, advanced nodes, and increasing wafer complexity.
Lam sits right in the middle of that.
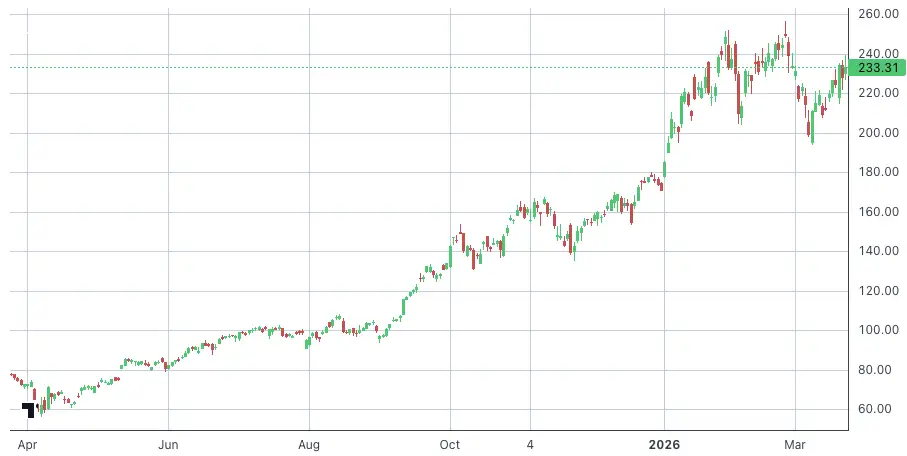
So when you get a pullback, like the one we’re seeing now, it becomes less about fear and more about opportunity. If you believe in the broader semiconductor buildout, this is the type of name you lean into, not away from.
Longer term, there’s no reason it can’t push back toward new highs and potentially work its way into the $300 range as the cycle strengthens.
That said, from a pure setup and valuation standpoint, we still lean toward ACMR. It offers a bit more asymmetry right now. But if ACMR didn’t exist, Lam would easily sit at the top of the list as a core semi exposure.
Description: Lam Research is one of the largest semiconductor wafer fabrication equipment manufacturers in the world. It specializes in deposition and etch, which entail the buildup of layers on a semiconductor and the subsequent selective removal of patterns from each layer. Lam holds the top market share in etch and holds the clear second share in deposition. It is more exposed to memory chipmakers for DRAM and NAND chips. It counts as top customers the largest chipmakers in the world, including TSMC, Samsung, Intel, and Micron.
Lam Research a leading semiconductor equipment supplier, delivered stronger-than-expected second-quarter earnings and revenue, while issuing third-quarter guidance above analysts’ estimates.
The company is benefiting from the ongoing AI boom, which is driving significant investment in advanced chips, such as high-bandwidth memory, that rely on Lam’s specialized deposition and etch equipment for complex manufacturing processes.
In Q2, earnings per share came in at $1.27, surpassing the $1.17 consensus, and revenue grew 22.1% year-over-year to $5.34 billion, beating the $5.23 billion expected.
Looking ahead, Lam expects Q3 EPS of $1.25–$1.45 and revenue of $5.4– $6.0 billion, signaling strong ongoing demand. Its deposition and etch capabilities position Lam as a critical supplier for next-generation semiconductor architectures, including gate-all-around transistors and advanced 3D packaging.
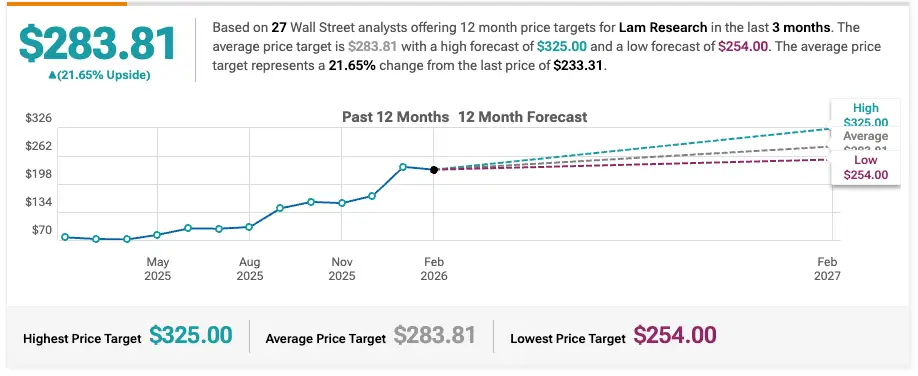
Barclays Maintains Equal-Weight on Lam Research, Raises Price Target to $255
Morgan Stanley Maintains Equal-Weight on Lam Research, Raises Price Target to $254
Citigroup Maintains Buy on Lam Research, Raises Price Target to $300
Cantor Fitzgerald Maintains Overweight on Lam Research, Raises Price Target to $320

Company: GE Vernova
Quote: $GEV
Bull Case:
GE Vernova has demonstrated impressive momentum across its business lines. Total orders surged roughly 65% year-over-year to $22.2 billion, led by the Power segment, which not only grew revenue 6% to $5.75 billion but also saw an organic orders increase of 77%. The company raised its FY26 revenue guidance to $44–$45 billion, reflecting confidence in ongoing demand, and margins in the Power equipment segment expanded meaningfully, driven by price and productivity gains. The Electrification segment also showed strong performance, with a $2.3 billion increase in backlog quarter-over-quarter, signaling sustained demand in strategic regions like North America and the Middle East.
Bear Case:
Despite the strong growth, GE Vernova faces a number of risks. The potential expiration of the ITC/PTC incentives for wind projects by 2027 could depress long-term demand for renewable energy equipment. A broader economic slowdown or recession may constrain sales across the business, and any downgrade from its investment-grade credit rating could increase borrowing costs and reduce operational flexibility. Additionally, the wind segment represents a meaningful portion of revenue, and declines there could materially impact overall financial performance.
Sharks Opinion:
GE Vernova is a powerhouse in the utility and alternative energy space, and its positioning could not be more timely. If 2025 was when the market realized the AI revolution requires massive electricity, 2026 is proving who controls the grid infrastructure. Since its spin-off, the stock has surged from $252 to $911, driven by a massive backlog, record revenues, strong profits, and expanding margins.
The company is executing well across both Power and Electrification segments, but fundamentals suggest it may be overvalued in the short term. That makes any correction a prime entry point. For long-term investors, GE Vernova is a clear leader in energy infrastructure with a compelling role in the ongoing energy transition.
Description: GE Vernova is a global leader in the electric power industry, with products and services that generate, transfer, convert, and store electricity. The company has three business segments: power, wind, and electrification. Power includes gas, nuclear, hydroelectric, and steam technologies, providing dispatchable power. The wind segment includes wind generation technologies, inclusive of onshore and offshore wind turbines and blades. Electrification includes grid solutions, power conversion, electrification software, and solar and storage solutions technologies required for the transmission, distribution, conversion, and storage of electricity from the point of generation to point of consumption.
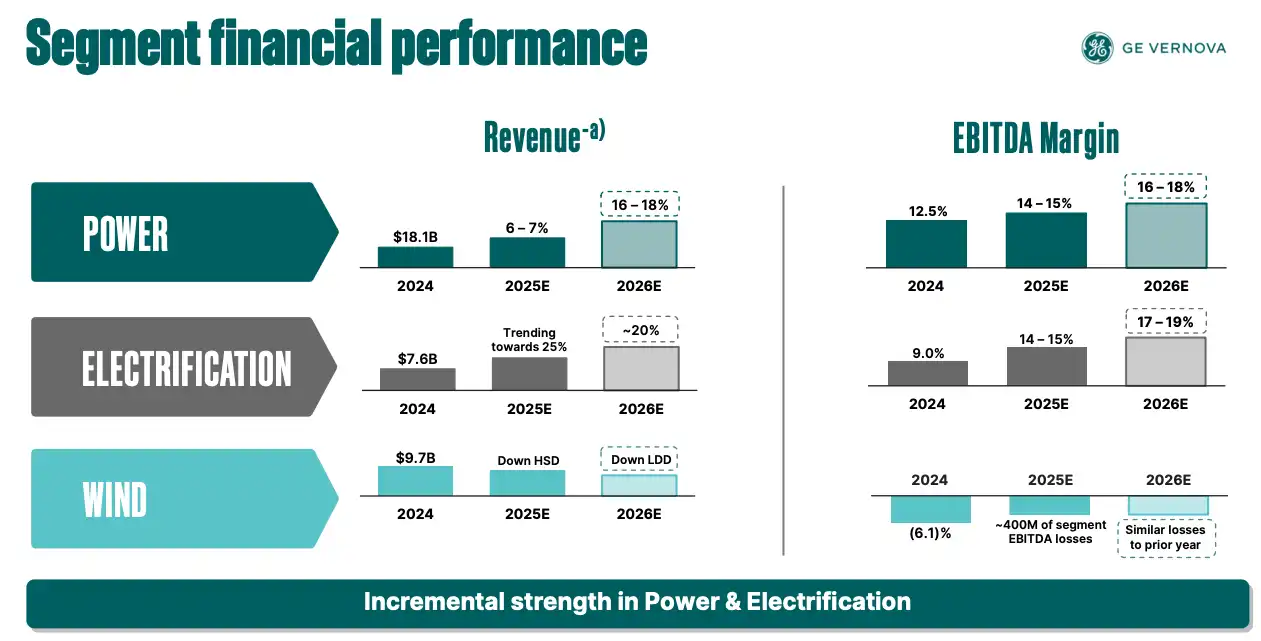
GE Vernova operates across three core segments:
Power, Wind, and Electrification. In 2025, the company generated $38.1 billion in total revenue, up 9% year-over-year.
The Power segment, covering gas, nuclear, hydro, and steam technologies, led growth with $19.8 billion in revenue and a 14.7% EBITDA margin, driven by strong equipment demand and double-digit services growth.
Wind faced headwinds, with revenue declining to $9.1 billion and an EBITDA loss of $0.6 billion, impacted by policy shifts and offshore project delays, though onshore orders grew organically by 8%.
Electrification was the standout, generating $9.6 billion in revenue a 28% increase and $1.4 billion in EBITDA with a 14.9% margin, fueled by grid modernization and expansion in North America and the Middle East.
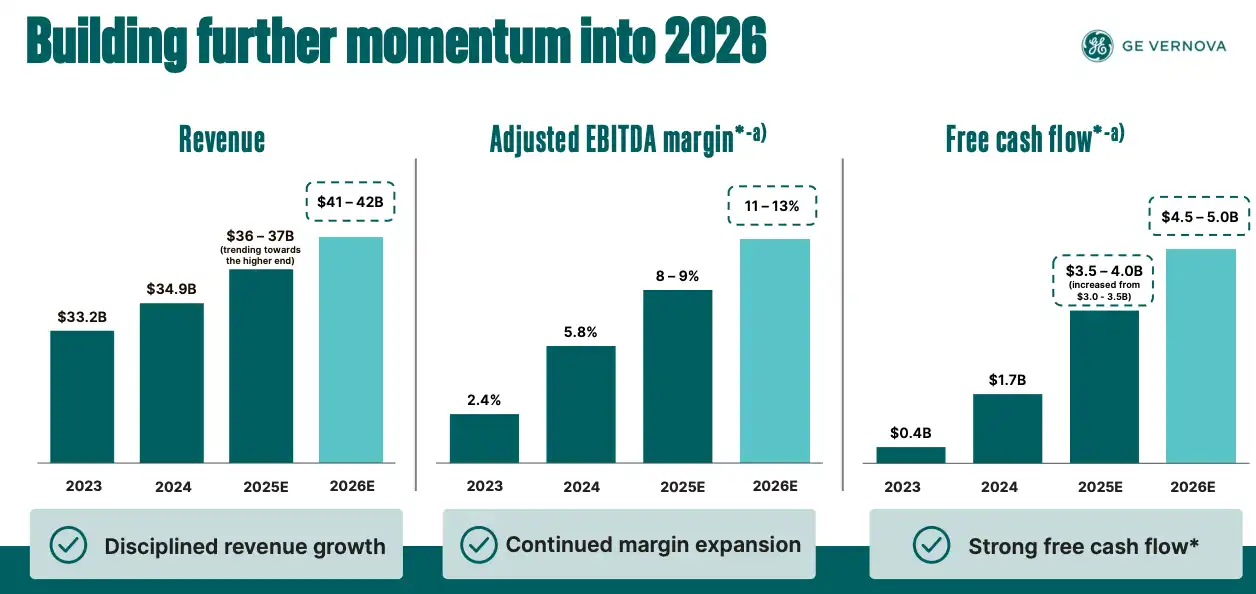
For 2026 and beyond, GE Vernova is positioned for continued growth, with revenue guidance raised to $44–$45 billion, partially driven by the pending Prolec GE acquisition.
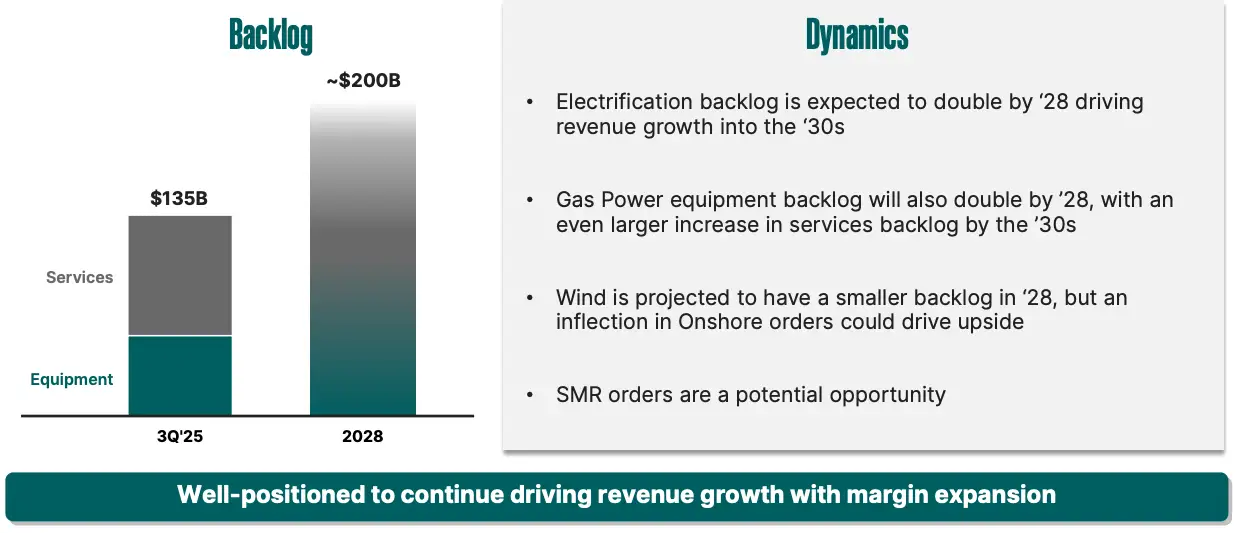
At the end of 2025, the company’s backlog provided strong visibility into future cash flows and equipment demand.
The services backlog reached $86 billion, up 13% year-over-year, while equipment backlog surged 50% to $64 billion, supported by disciplined pricing that added roughly $8 billion in margin.
By segment, the Power division’s total backlog is approximately $110 billion, with $70 billion coming from services. Gas turbine demand remains robust, with slot reservations jumping to 83 GW in Q4 2025 and management projecting full capacity through 2030. Electrification saw its backlog grow to $35 billion, driven in part by $2 billion in orders from data center hyperscalers, triple the previous year’s total.
The Wind segment, while smaller, secured $3 billion in Q4 orders, highlighted by 1.1 GW of onshore U.S. repowering projects, marking its strongest quarter of the year. This mix of high backlog, expanding margins, and targeted growth areas underscores GE Vernova’s strategic positioning across energy infrastructure.
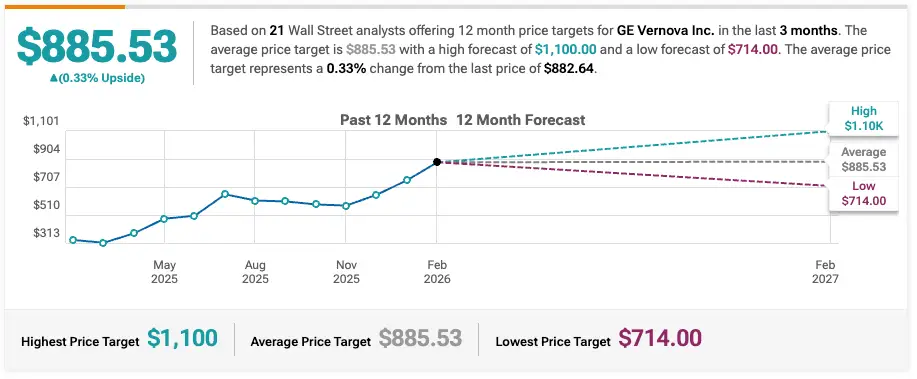
Morgan Stanley Maintains Overweight on GE Vernova, Raises Price Target to $960
Rothschild & Co Upgrades GE Vernova to Buy, Raises Price Target to $1100
RBC Capital Maintains Outperform on GE Vernova, Raises Price Target to $800
Goldman Sachs Maintains Buy on GE Vernova, Raises Price Target to $925

Company: STAAR Surgical
Quote: $STAA
Bull Case:
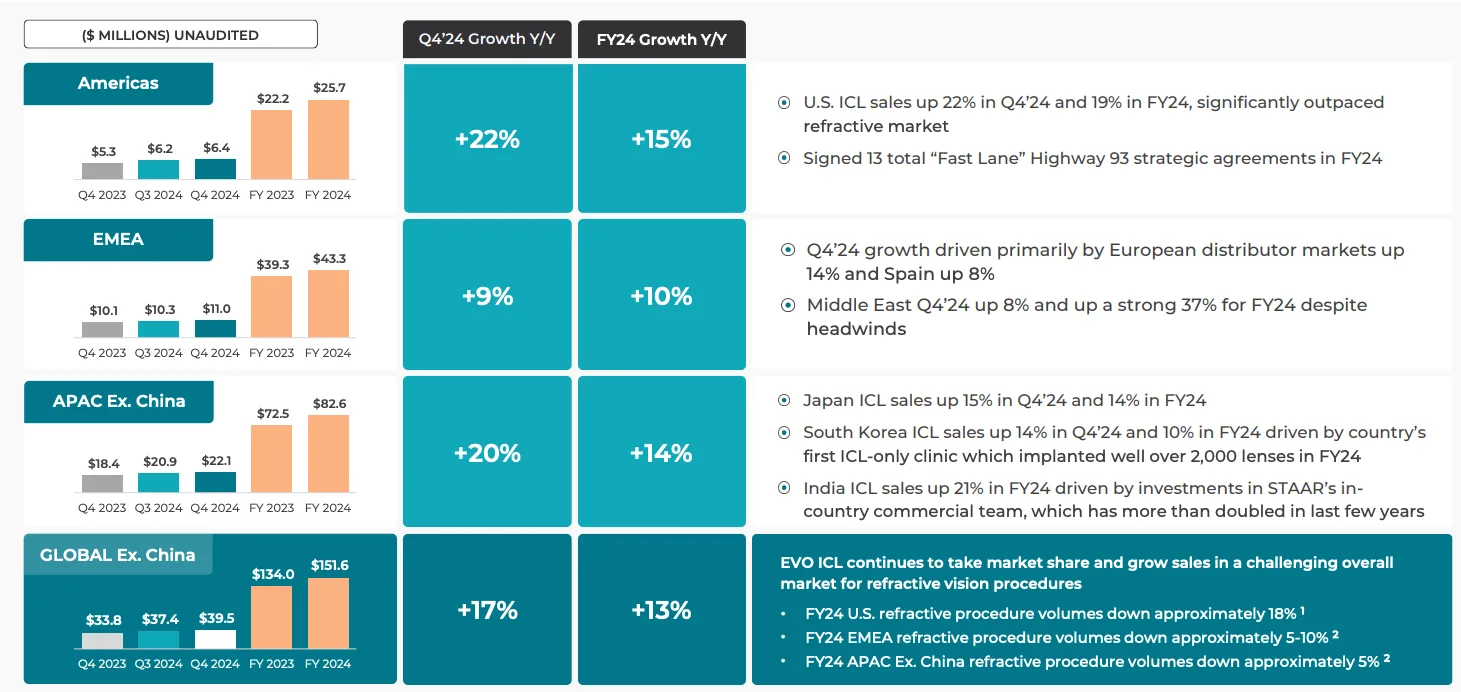
Staar Surgical Co. is positioned to benefit from the growing ophthalmic surgical and diagnostic devices market, projected to reach $20.1 billion by 2025, reflecting a modest but steady 2.9% CAGR since 2019. Its Implantable Collamer Lenses (ICL) have steadily gained market share, rising from 14.3% in 2019 to an estimated 26.5% in 2025, highlighting strong demand and a competitive edge over traditional procedures. Recent merger interest, representing a premium to prior valuations, signals market recognition of Staar’s improving trajectory, particularly as the company continues to expand post-FDA approval adoption and operational efficiencies.
Bear Case:
Staar faces significant headwinds, including a dramatic 82% year-over-year collapse in China sales, which has severely impacted overall revenue and contributed to ongoing EBITDA losses. The company’s geographic concentration in China raises concerns over potential market share loss to local competitors, while macroeconomic weakness could delay a sustained revenue recovery. These challenges have placed the stock at a meaningful discount to historical valuation multiples and suggest continued execution risk as the company attempts to stabilize its operations and profitability.
Sharks Opinion:
Last year, Staar turned down a merger offer that represented a 74% premium to its 90-day volume-weighted average price. Since then, the stock has remained essentially flat, reflecting the market pricing in further downside if new M&A activity does not materialize. Sales growth appears limited, margins are thin, and the company remains unprofitable, making it a difficult stock to back from a fundamental perspective. M&A developments could change the outlook, but absent that, Staar remains a challenging position for investors seeking strong upside.
Description: Staar Surgical Co is a manufacturer of lenses. It designs, develops, manufactures, and sells implantable lenses for the eye and delivery systems used to deliver the lenses into the eye. The company offers two types of products: Implantable Collamer lenses (ICL), which are used in refractive surgery. The company generates almost all of its revenue from the sale of its ICL products. Geographically, the company generates key revenue from Foreign sales.
Geographic Revenue Breakdown (FY 2025)
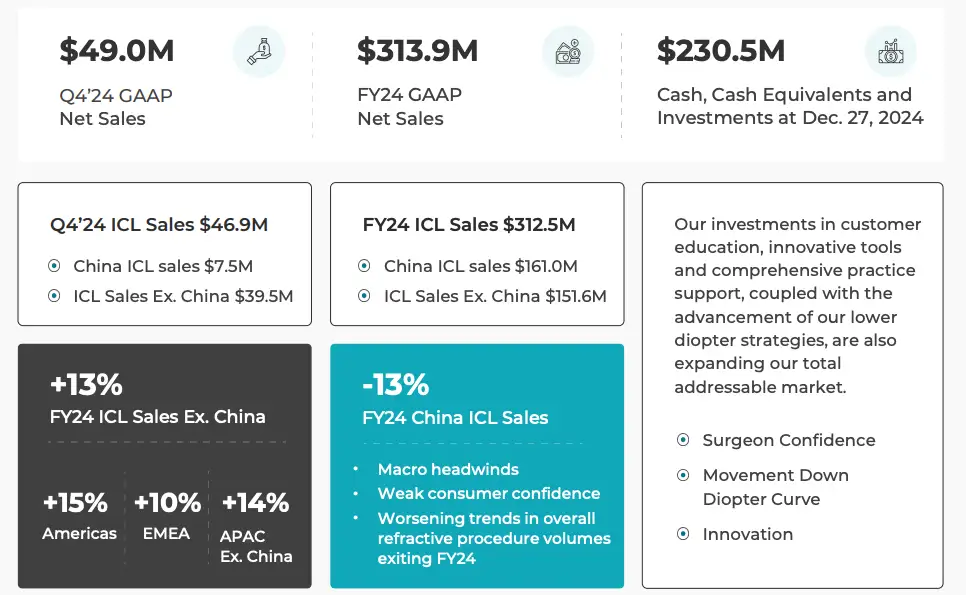
China continues to be STAAR’s most critical and volatile market. Revenue included $27.5 million in Q2 and Q3 2025 from a deferred shipment in December 2024, but the region faced significant channel inventory reductions during the first half of the year, resulting in a full-year decline in net sales. To support future growth and higher average selling prices, the company launched the EVO+ lens in China in late 2025.
Outside China, total revenue reached $161.7 million, up 6.6% from $151.6 million in 2024. Key growth markets included India, Japan, and South Korea, showing steady international expansion. The United States remains a smaller segment, representing roughly 6% of total revenue, while the EMEA region saw a 10% increase in sales, maintaining positive momentum from 2024.
Revenue by Product Segment:
Implantable Collamer Lenses (ICLs) continue to dominate, accounting for nearly all of STAAR’s revenue. The EVO family including EVO ICL, EVO+ ICL, and EVO Visian ICL drives the majority of sales. Other older intraocular lenses (IOLs) for cataract surgery have been largely phased out, allowing the company to focus exclusively on its ICL refractive business.
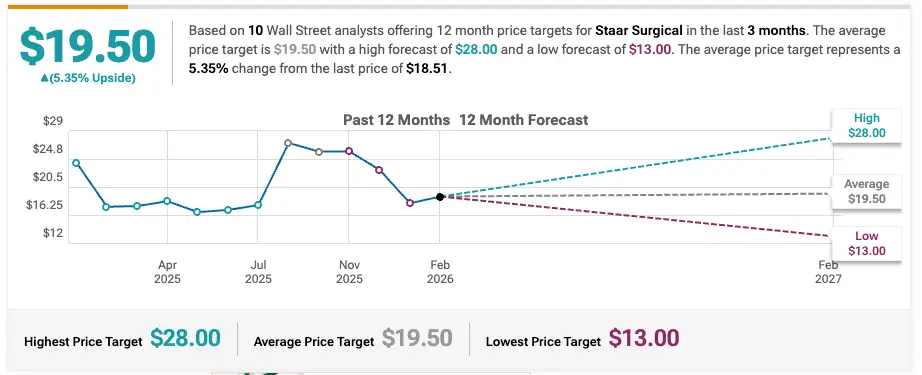
Wells Fargo Maintains Equal-Weight on Staar Surgical, Lowers Price Target to $16
Stifel Maintains Hold on Staar Surgical, Lowers Price Target to $18
Wedbush Initiates Coverage On Staar Surgical with Neutral Rating, Announces Price Target of $26

Company: Nutanix, Inc
Quote: $NTNX
Bull Case:
Nutanix Inc. delivered solid financial performance, with revenue rising 10% year-overyear to $723 million and surpassing analyst estimates, driven primarily by strong term license sales and a healthy bookings outlook. Annual Recurring Revenue (ARR) climbed to $2.28 billion, an 18% increase from the prior year, while net new ARR accelerated to 17%, reflecting robust customer demand and confidence in the company’s hybrid multicloud platform. With steady renewals, improving free cash flow, and a market position benefiting from ongoing disruption, Nutanix is well-positioned for continued growth and long-term financial success.
Bear Case:
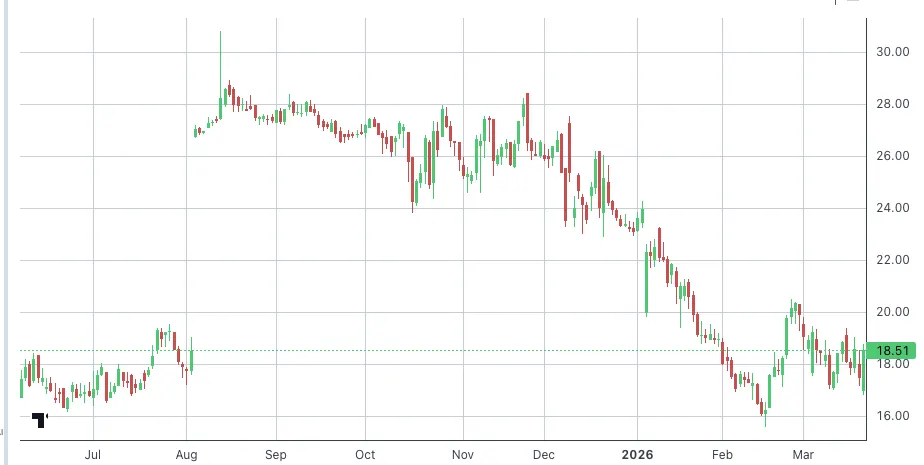
Despite its recent gains, Nutanix has faced headwinds, including a roughly 15% stock decline after missing revenue expectations for the first time in over five years. Reported revenue of $670.6 million fell at the low end of management guidance, signaling a slowdown in growth compared to prior years. Challenges such as supply chain constraints and delayed deal closures have weighed on results, and the company’s fiscal year 2026 guidance was trimmed by 3%, reflecting uncertainty around near-term growth and financial performance.
Sharks Opinion:
Nutanix remains compelling, particularly in the context of a broader software selloff that may create attractive entry points. Each time the stock touches a new 52-week low, it captures our attention. Nutanix offers a comprehensive hybrid multicloud platform, combining virtualization, storage, networking, Kubernetes, database-as-a-service, and multicloud management services under one unified infrastructure. Historically, we have seen strong performance with this name, including at IPO, and if shares dip further below $38, it could present a favorable opportunity for entry.
Description: Nutanix Inc is engaged in cloud software, offering organizations a single platform for running applications and managing data anywhere. Its Nutanix Cloud Platform is designed to enable organizations to build a hybrid multicloud infrastructure, providing a consistent cloud operating model with a single platform for running applications and managing data in core data centers, at the edge, and in public clouds, all while supporting a variety of hypervisors and container platforms. The company operates a single operating and reportable segment based on a subscription business model. It conducts business in the United States, Europe, the Middle East and Africa, Asia Pacific, and other Americas, with key revenue generated from the United States.
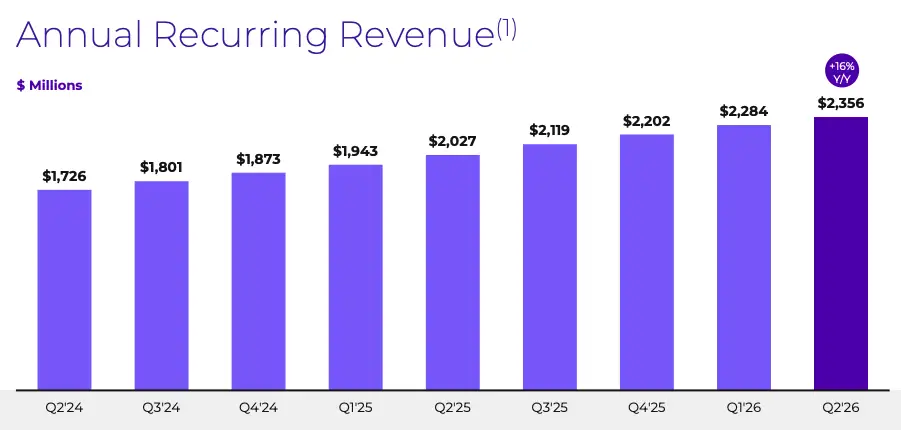
Nutanix tracks Annual Recurring Revenue, or ARR, as a key indicator of the health and growth of its subscription-based business model. ARR represents the total annualized value of all active subscription contracts at the end of a reporting period, and for Q2 FY2026, it reached $2.356 billion, marking a 16% increase year-over-year.
The company reported revenue of $722.8 million for the quarter, up 10% from the prior year and above its guidance range of $705–$715 million.
Profitability showed meaningful improvement, with GAAP net income of $103 million, or $0.36 per share, compared to previous losses, and non-GAAP net income of $164 million, or $0.56 per share, surpassing analyst expectations of $0.44 per share.
Margins remain strong, with a non-GAAP gross margin of 88.6% and an operating margin of 26.2%, well above guidance.
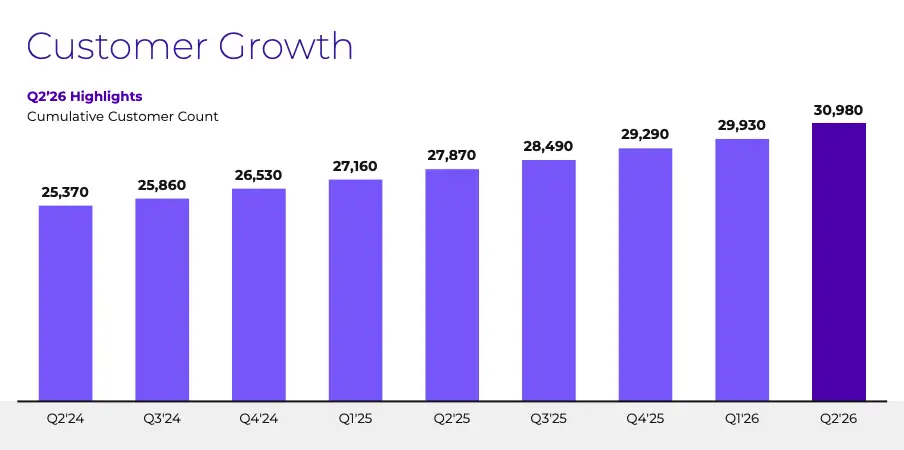
Free cash flow came in at $191.4 million, reflecting a 26% margin, while customer growth accelerated, adding over 1,000 new clients the largest quarterly increase in eight years bringing the total customer base to 30,980.
Looking ahead, Nutanix narrowed its FY2026 revenue guidance to $2.8–$2.84 billion.
Management noted that ongoing CPU and memory shortages are extending server lead times, causing some revenue and cash flow to shift into future quarters, though demand remains robust.
The company also announced a $150 million partnership with AMD to develop an agentic AI platform, further strengthening its position in enterprise AI infrastructure and signaling long-term growth potential.
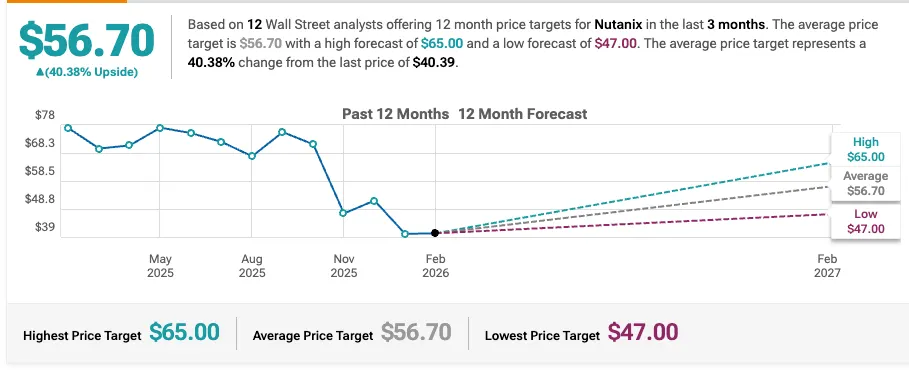
UBS Maintains Buy on Nutanix, Raises Price Target to $60
Wells Fargo Maintains Equal-Weight on Nutanix, Lowers Price Target to $50
Piper Sandler Maintains Overweight on Nutanix, Lowers Price Target to $63
Barclays Maintains Equal-Weight on Nutanix, Lowers Price Target to $47